

| << Chapter < Page | Chapter >> Page > |
Gasoline consumption in the United States has been steadily increasing. Consumption data from 1994 to 2004 is shown in [link] . http://www.bts.gov/publications/national_transportation_statistics/2005/html/table_04_10.html Determine whether the trend is linear, and if so, find a model for the data. Use the model to predict the consumption in 2008.
| Year | '94 | '95 | '96 | '97 | '98 | '99 | '00 | '01 | '02 | '03 | '04 |
| Consumption (billions of gallons) | 113 | 116 | 118 | 119 | 123 | 125 | 126 | 128 | 131 | 133 | 136 |
The scatter plot of the data, including the least squares regression line, is shown in [link] .
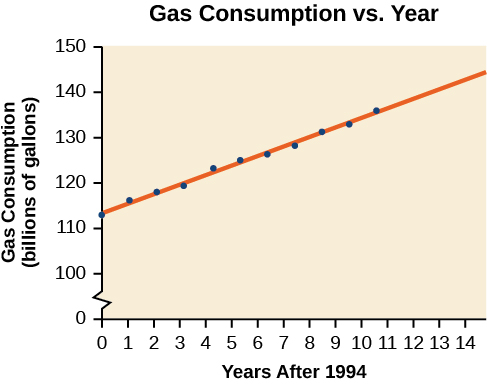
We can introduce new input variable, t, representing years since 1994.
The least squares regression equation is:
Using technology, the correlation coefficient was calculated to be 0.9965, suggesting a very strong increasing linear trend.
Using this to predict consumption in 2008 (t=14),
The model predicts 144.244 billion gallons of gasoline consumption in 2008.
Use the model we created using technology in [link] to predict the gas consumption in 2011. Is this an interpolation or an extrapolation?
150.871 billion gallons; extrapolation
Access these online resources for additional instruction and practice with fitting linear models to data.
Describe what it means if there is a model breakdown when using a linear model.
When our model no longer applies, after some value in the domain, the model itself doesn’t hold.
What is interpolation when using a linear model?
What is extrapolation when using a linear model?
We predict a value outside the domain and range of the data.
Explain the difference between a positive and a negative correlation coefficient.
Explain how to interpret the absolute value of a correlation coefficient.
The closer the number is to 1, the less scattered the data, the closer the number is to 0, the more scattered the data.
A regression was run to determine whether there is a relationship between hours of TV watched per day (x) and number of sit-ups a person can do (y). The results of the regression are given below. Use this to predict the number of sit-ups a person who watches 11 hours of TV can do.
Notification Switch
Would you like to follow the 'Algebra and trigonometry' conversation and receive update notifications?

|
|
|
|
|

|
|

|
|

|
|

|
|

|
|
|
|
|

|
|

|
|

|
|

|