| << Chapter < Page | Chapter >> Page > |
Using the graph in [link] , (a) find g−1(1), and (b) estimate g−1(4).
a. 3; b. 5.6
Sometimes we will need to know an inverse function for all elements of its domain, not just a few. If the original function is given as a formula— for example, y as a function of x— we can often find the inverse function by solving to obtain x as a function of y.
Given a function represented by a formula, find the inverse.
Find a formula for the inverse function that gives Fahrenheit temperature as a function of Celsius temperature.
By solving in general, we have uncovered the inverse function. If
then
In this case, we introduced a function h to represent the conversion because the input and output variables are descriptive, and writing C−1 could get confusing.
Find the inverse of the function f(x)=2x−3+4.
So f−1(y)=2y−4+3 or f−1(x)=2x−4+3.
Find the inverse of the function f(x)=2+√x−4.
So f−1(x)=(x−2)2+4.
The domain of f is [4,∞). Notice that the range of f is [2,∞), so this means that the domain of the inverse function f−1 is also [2,∞).
What is the inverse of the function f(x)=2−√x? State the domains of both the function and the inverse function.
f−1(x)=(2−x)2; domain of f: [0,∞); domain of f−1: (−∞,2]
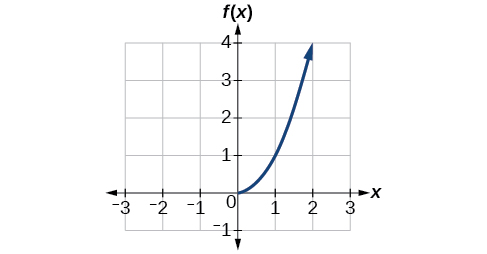
Now that we can find the inverse of a function, we will explore the graphs of functions and their inverses. Let us return to the quadratic function f(x)=x2 restricted to the domain [0,∞), on which this function is one-to-one, and graph it as in [link] .

Restricting the domain to [0,∞) makes the function one-to-one (it will obviously pass the horizontal line test), so it has an inverse on this restricted domain.
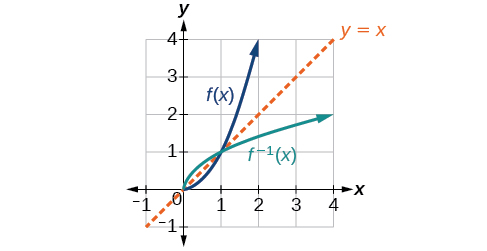
We already know that the inverse of the toolkit quadratic function is the square root function, that is, f−1(x)=√x. What happens if we graph both f and f−1 on the same set of axes, using the x- axis for the input to both f and f−1?
We notice a distinct relationship: The graph of f−1(x) is the graph of f(x) reflected about the diagonal line y=x, which we will call the identity line, shown in [link] .

This relationship will be observed for all one-to-one functions, because it is a result of the function and its inverse swapping inputs and outputs. This is equivalent to interchanging the roles of the vertical and horizontal axes.
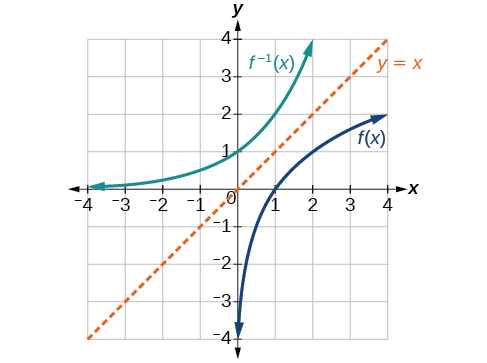
Given the graph of f(x) in [link] , sketch a graph of f−1(x).

This is a one-to-one function, so we will be able to sketch an inverse. Note that the graph shown has an apparent domain of (0,∞) and range of (−∞,∞), so the inverse will have a domain of (−∞,∞) and range of (0,∞).
If we reflect this graph over the line y=x, the point (1,0) reflects to (0,1) and the point (4,2) reflects to (2,4). Sketching the inverse on the same axes as the original graph gives [link] .


Notification Switch
Would you like to follow the 'Precalculus' conversation and receive update notifications?